Jay Jaffe FanGraphs Chat – 7/22/25
| 12:00 |
|
| 12:01 |
|
| 12:03 |
|
| 12:05 |
|
| 12:05 |
|
| 12:06 |
|
| 12:00 |
|
| 12:01 |
|
| 12:03 |
|
| 12:05 |
|
| 12:05 |
|
| 12:06 |
|
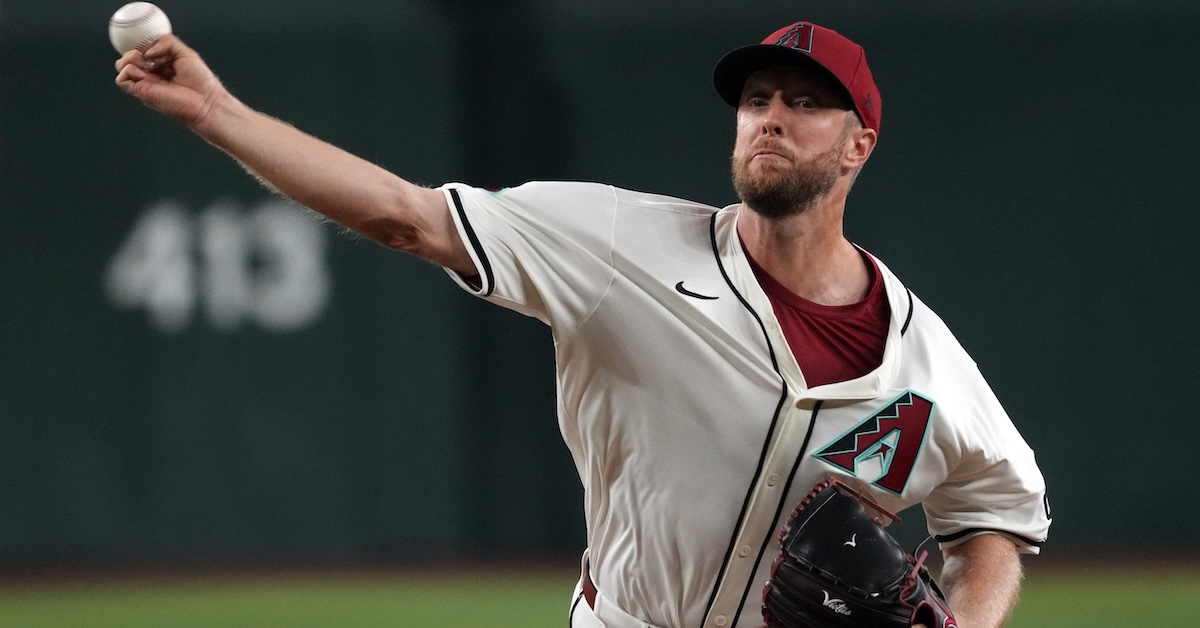
Merrill Kelly is having a rock-solid season. Over 21 starts comprising 122 innings, the 36-year-old right-hander has a 9-6 record to go with a 3.32 ERA and a 3.48 FIP. Those numbers are pretty much par for the course. Over the past three-plus seasons — all with the Arizona Diamondbacks — Kelly has made 97 starts and gone 39-22 with a 3.42 ERA and a 3.75 FIP. Neither overpowering nor of ace quality, Kelly is nonetheless a good pitcher who adds value to a big league rotation.
He could soon be taking the mound for a different team. Signed by the D-backs in December 2018 following a four-season stint in the KBO, Kelly is now on the doorstep of free agency; should Arizona decide to be sellers at the deadline, he could find himself in another team’s uniform come August 1. If that happens, the club that acquires him would be getting a known commodity. He has put up between 2.2 and 3.2 WAR in four of his last five seasons, with the exception coming last year, when injuries limited him to just 13 starts and 73 2/3 innings. His overall big league ledger reads: 62-49, 161 starts, 946 1/3 innings, 3.76 ERA, 3.97 FIP, 13.9 WAR.
With free agency looming, I spoke with the veteran hurler earlier this year about his approach to pitching, his evolution on the mound, and his steady performance since returning stateside.
“That’s an interesting question,” Kelly replied when asked how how he gets hitters out. “I would say that I do it in a lot of different ways. Ideally, I would like to get them out on as few pitches as possible. I guess you’d consider that a little bit more old school. Read the rest of this entry »
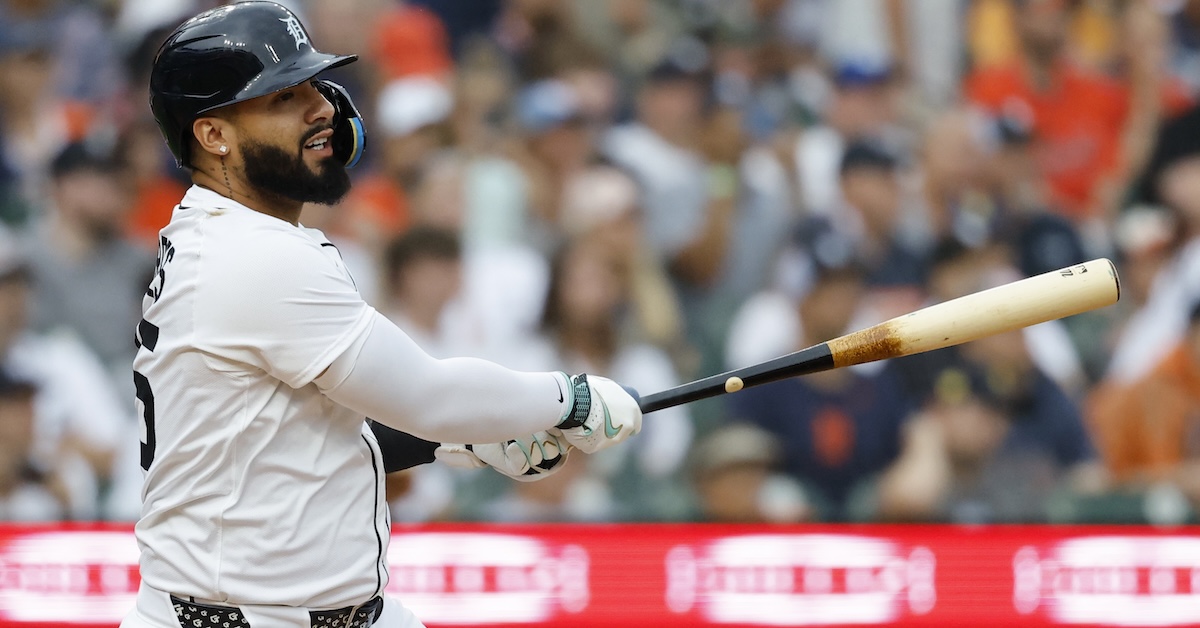
In the final days before the All-Star break, the Mariners threw 60 pitches to Gleyber Torres. I swear he didn’t make a single incorrect swing decision.
Fastball jammed inside on a 2-2 count? He’ll spoil it.
Slider dropped in the chase zone, low and away? Easy take.
Fastball pinned to the top edge in a full count? That’s a walk.
What’s a pitcher to do? Torres went 5-for-10 in the series with two doubles and two walks. It wasn’t the flashiest series, and it’s not really the flashiest batting line. He’s hitting .282/.390/.421 this year, which scans to me more as “very good” than “great.” But if there were an award for “most annoying at-bat,” I’d submit a nomination for Torres. Read the rest of this entry »

As is tradition at FanGraphs, we’re using the lead-up to the trade deadline to take stock of the top 50 players in baseball by trade value. For a more detailed introduction to this year’s exercise, as well as a look at the players who fell just short of the top 50, be sure to read the Introduction and Honorable Mentions piece, which can be found in the widget above.
For those of you who have been reading the Trade Value Series the last few seasons, the format should look familiar. For every player, you’ll see a table with the player’s projected five-year WAR from 2026-2030, courtesy of Dan Szymborski’s ZiPS projections. The table will also include the player’s guaranteed money, if any, the year through which their team has contractual control of them, last year’s rank (if applicable), and then projections, contract status, and age for each individual season through 2030 (assuming the player is under contract or team control for those seasons). Last year’s rank includes a link to the relevant 2024 post. Thanks are due to Sean Dolinar for his technical wizardry. At the bottom of the page, there is a grid showing all of the players who have been ranked up to this point.
One note on the rankings: Particularly at the bottom of the list, there isn’t a lot of room between the players. The ordinal rankings clearly matter, and we put them there for a reason, but there isn’t much of a gap between, say, the 38th-ranked player and the guy who would have been 58th if the list went that deep. The magnitude of the differences in this part of the list is quite small, though it picks up around no. 30, as I’ll discuss today. Several of the folks I talked to might prefer a player in the Honorable Mentions section to one on the back end of the list, or vice versa. I think the broad strokes are correct, and this is my opinion of the best order, but with so many players carrying roughly equivalent value, disagreements abounded. I’ll note the places where I disagreed meaningfully with the people I spoke with in calibrating this list, and I’ll also note players whose value was the subject of disagreement among my contacts. As I mentioned in the Introduction and Honorable Mentions piece, I’ll also indicate tier breaks between players where appropriate, both in their capsules and in the table at the end of the piece.
With that out of the way, let’s get to the next batch of players. Read the rest of this entry »
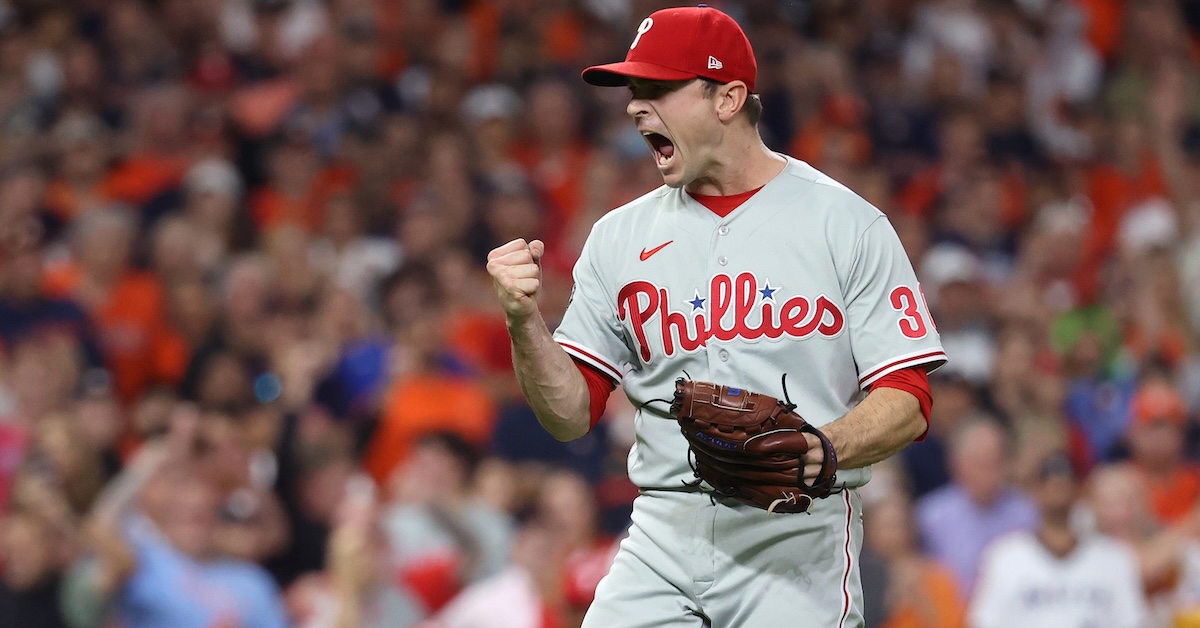
We’ve finally done it, friends. Everybody take a bow. It took until July 20, but we’ve finally found a home for the last holdout on Ben Clemens’ 2025 edition of the Top 50 Free Agents. On Sunday, the Phillies took their shot on lucky no. 46, agreeing to sign veteran reliever David Robertson to a $16 million contract. Prorated for the late start date, the contract will actually pay the right-hander somewhere around $6 million. Ken Rosenthal of The Athletic broke the news, while MLB.com’s Mark Feinsand reported the contract details. According to Matt Gelb, also of The Athletic, Robertson will need a ramp-up period, which means he’ll need to agree to an assignment in the minors.
So why the hell did this take so long? Here’s my best answer: Uhh… ageism?
Let’s start with Robertson’s blurb from the top 50, which I don’t feel bad about plagiarizing here because I wrote it:
Over the past three seasons, Robertson has a 2.82 ERA and a 3.24 FIP. Over 188 appearances and 201 innings, he’s accrued 3.8 WAR, 12th most among all relievers. As he enters his age-40 season, Robertson is coming off his best FIP since 2017. His cutter averaged 93.3 mph in both 2023 and 2024, the fastest it’s been since Obama’s first term. According to Statcast’s run values, that cutter was worth 19 runs this season, making it the sixth-most valuable pitch in all of baseball. Knowing what it knows about aging curves and the volatility of relief arms, ZiPS projects Robertson for 0.5 WAR, but we humans should at the very least be open to the possibility that he’ll live forever. Until we see him fall apart with our own eyes, there’s no reason in particular to believe that he won’t just keep serving as an effective bullpen arm until sometime in the middle of the next decade. Robertson’s fourth straight one-year contract with a playoff hopeful would do quite nicely.
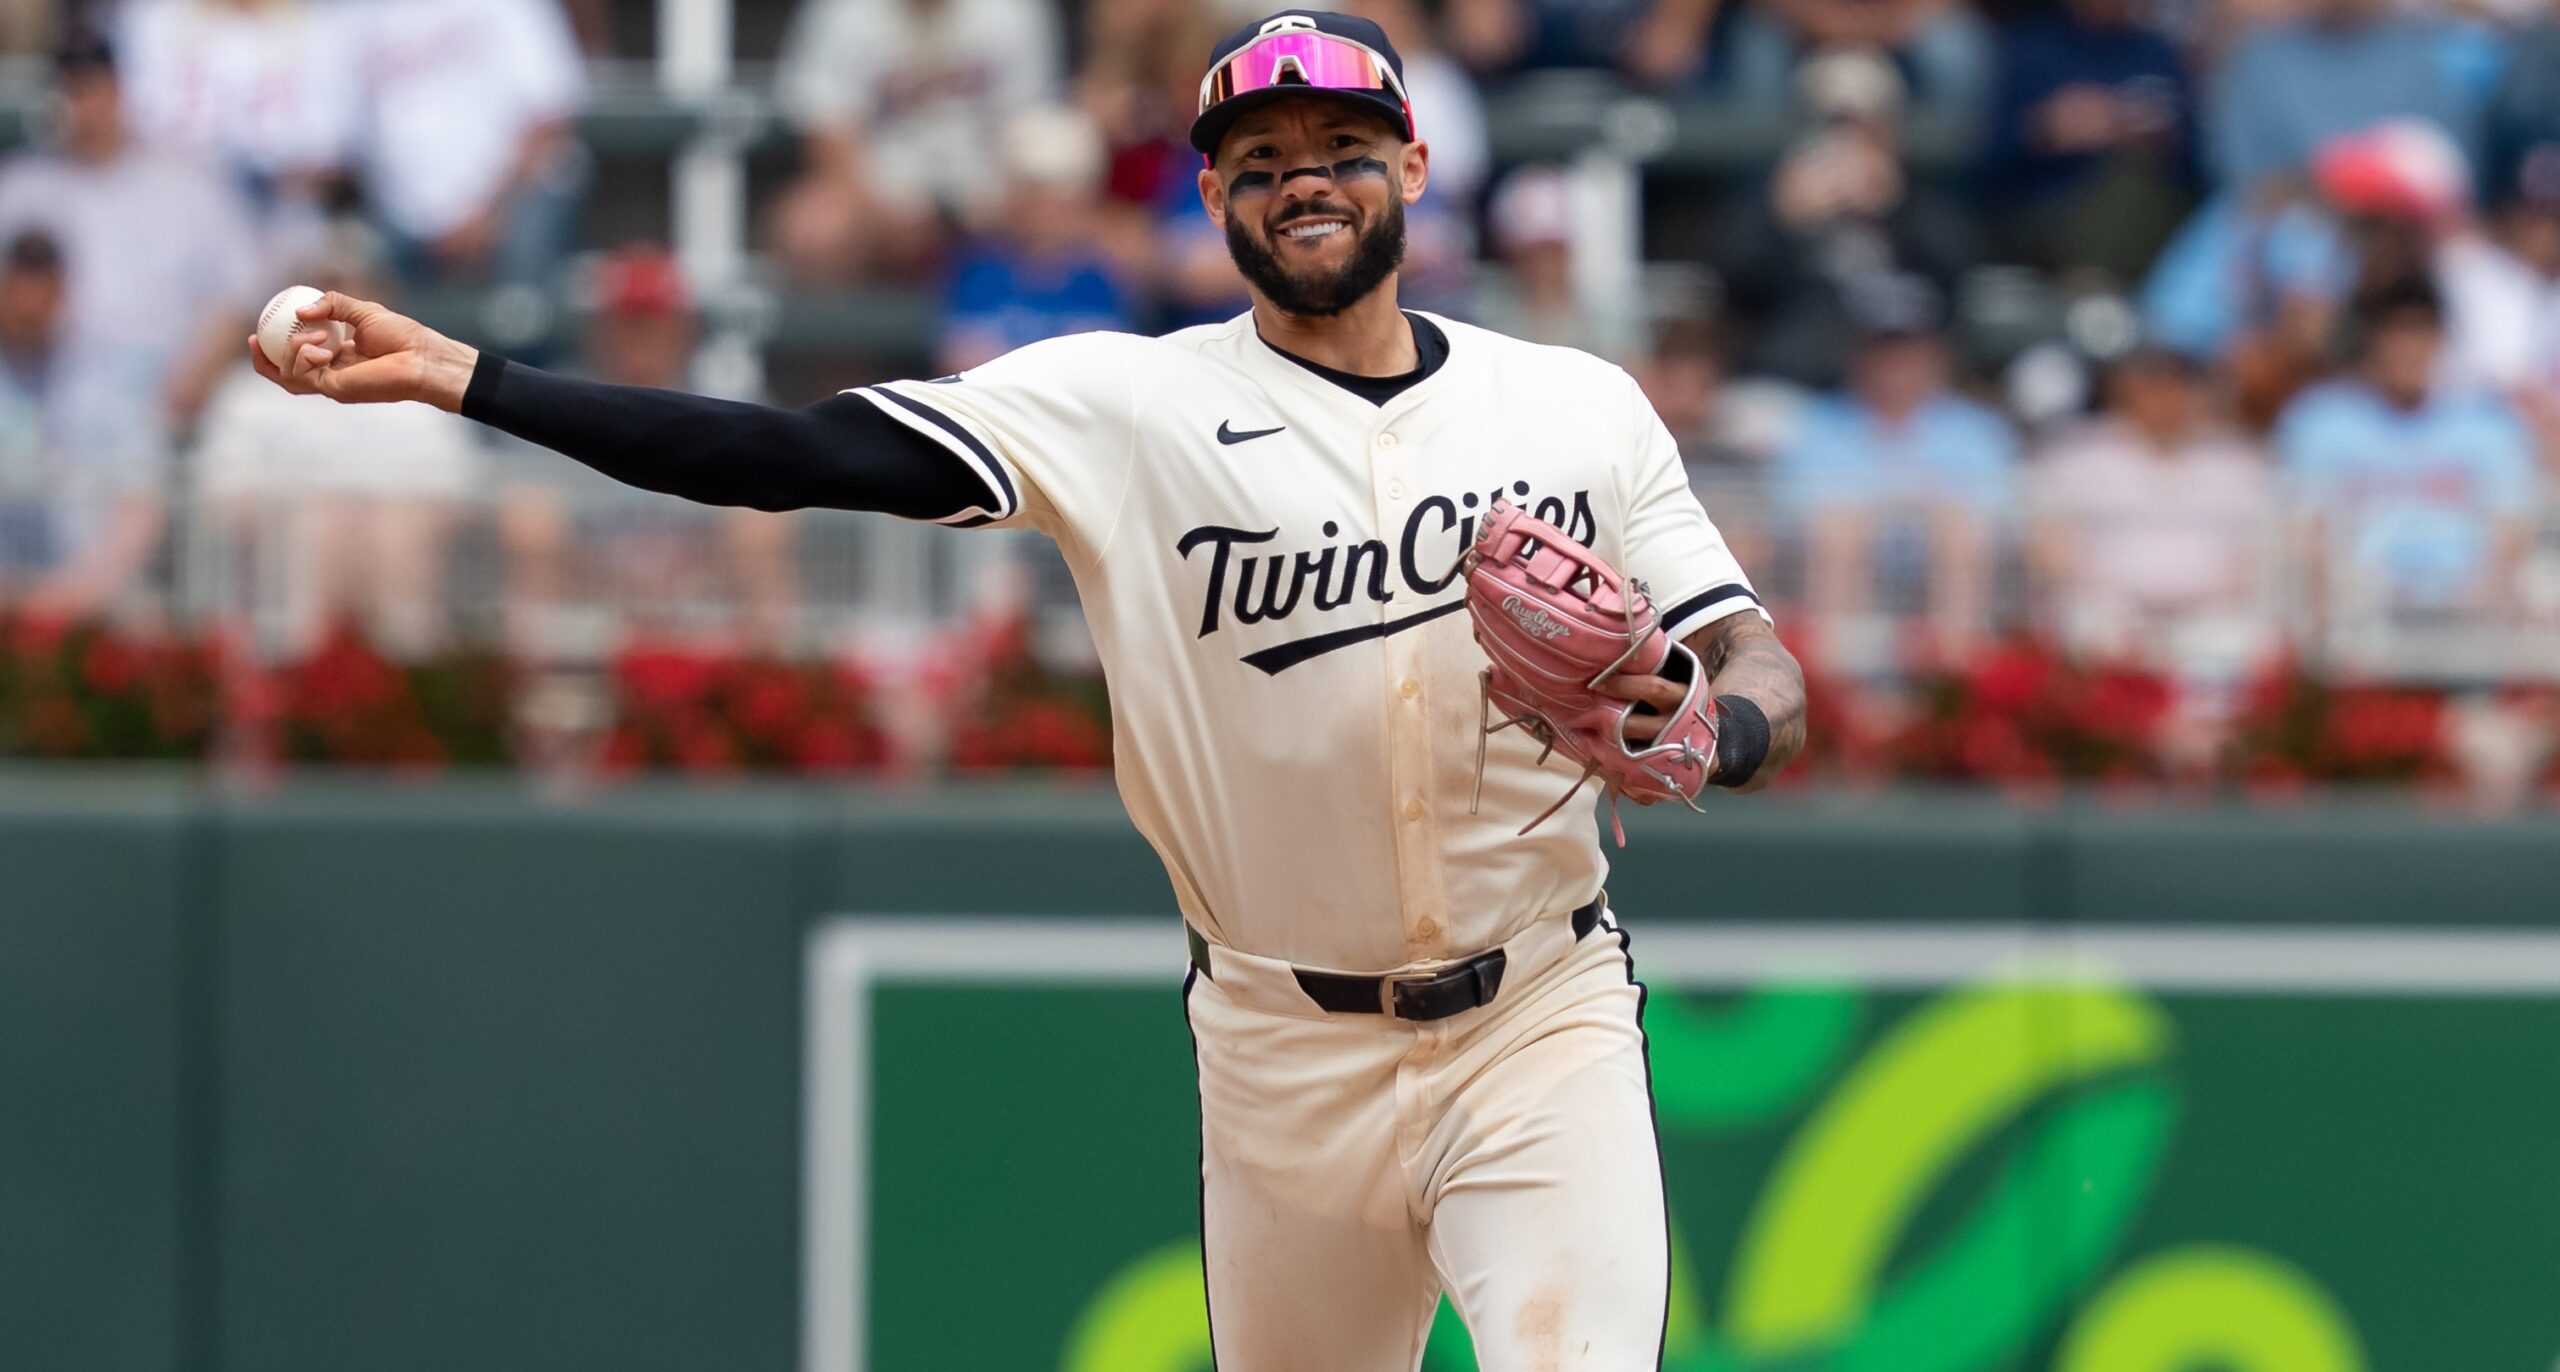
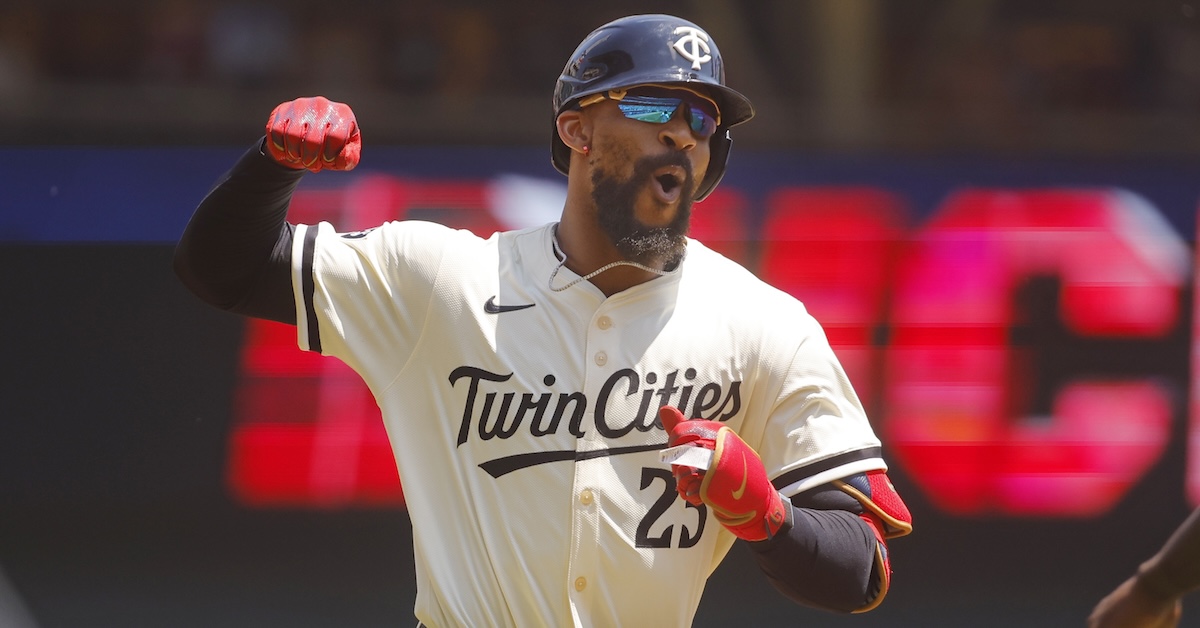
If you followed along with my Replacement Level Killers series, you’re no doubt familiar with the disheveled state of the Twins. After last year’s epic late-season collapse, Minnesota started slowly, clawed its way back into contention, and then stumbled during a 9-18 June; the team is now 48-51 with 17.5% Playoff Odds, still good enough to qualify for my series highlighting the weakest spots on contenders. Within that series, the Twins made a major league-high five appearances: at catcher, first base, second base, third base, and right field. An underrated part of their struggles is their defense. To the extent that they can still be considered contenders, their glovework stands out as the worst of any playoff hopeful based upon the methodology I used to identify the best team defenses thus far a few weeks ago.
Along with that piece, this is part of my annual midseason dip into the alphabet soup of defensive metrics, including Defensive Runs Saved (DRS), Statcast’s Fielding Run Value (FRV), and our own catcher framing metric (hereafter abbreviated as FRM, as it is on our stat pages). Longtime standby Ultimate Zone Rating has been retired, which required me to adjust my methodology.
On an individual level, even a full season of data isn’t enough to get the clearest picture of a player’s defense. Indeed, it’s not at all surprising that samples of 800 innings or fewer produce divergent values across the major metrics; different methodologies produce varying spreads in runs from top to bottom, spreads that owe something to what they don’t measure, as well as how much regression is built into their systems. Pitchers don’t have FRVs, and DRS tends to produce more extreme ratings (positive and negative) than Statcast. But within this aggregation, I think we get enough signal roughly 60% of the way through the season to justify checking in; I don’t proclaim this to be a bulletproof methodology so much as a good point of entry into a broad topic. Read the rest of this entry »
As is tradition at FanGraphs, we’re using the lead-up to the trade deadline to take stock of the top 50 players in baseball by trade value. For a more detailed introduction to this year’s exercise, as well as a look at the players who fell just short of the top 50, be sure to read the Introduction and Honorable Mentions piece, which can be found in the widget above.
For those of you who have been reading the Trade Value Series the last few seasons, the format should look familiar. For every player, you’ll see a table with the player’s projected five-year WAR from 2026-2030, courtesy of Dan Szymborski’s ZiPS projections. The table will also include the player’s guaranteed money, if any, the year through which their team has contractual control of them, last year’s rank (if applicable), and then projections, contract status, and age for each individual season through 2030 (assuming the player is under contract or team control for those seasons). Last year’s rank includes a link to the relevant 2024 post. Thanks are due to Sean Dolinar for his technical wizardry. At the bottom of the page, there is a grid showing all of the players who have been ranked up to this point.
One note on the rankings: Particularly at the bottom of the list, there isn’t a lot of room between the players. The ordinal rankings clearly matter, and we put them there for a reason, but there isn’t much of a gap between, say, the 38th-ranked player and the guy who would have been 58th if the list went that deep. The magnitude of the differences in this part of the list is quite small. Several of the folks I talked to might prefer a player in the Honorable Mentions section to one on the back end of the list, or vice versa. I think the broad strokes are correct, and this is my opinion of the best order, but with so many players carrying roughly equivalent value, disagreements abounded. I’ll note places where I disagreed meaningfully with the people I spoke with in calibrating this list, and I’ll also note players whose value was the subject of disagreement among my contacts. As I mentioned in the Introduction and Honorable Mentions piece, I’ll also indicate tier breaks between players where appropriate, both in their capsules and in the table at the end of the piece.
With that out of the way, let’s get to the first batch of players. Read the rest of this entry »
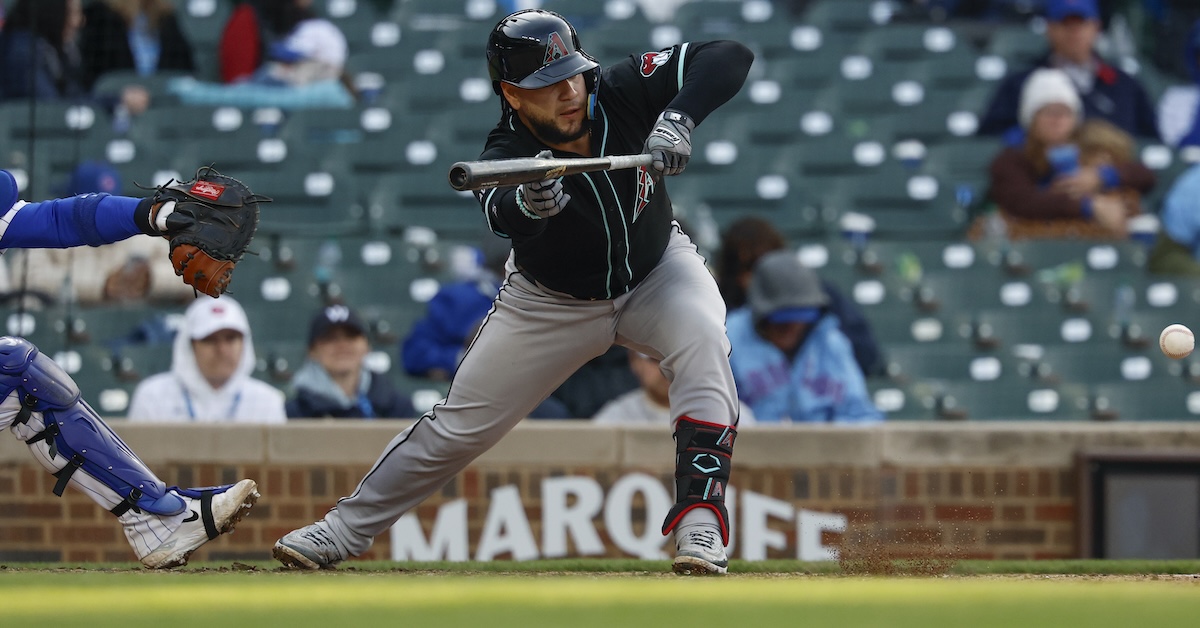
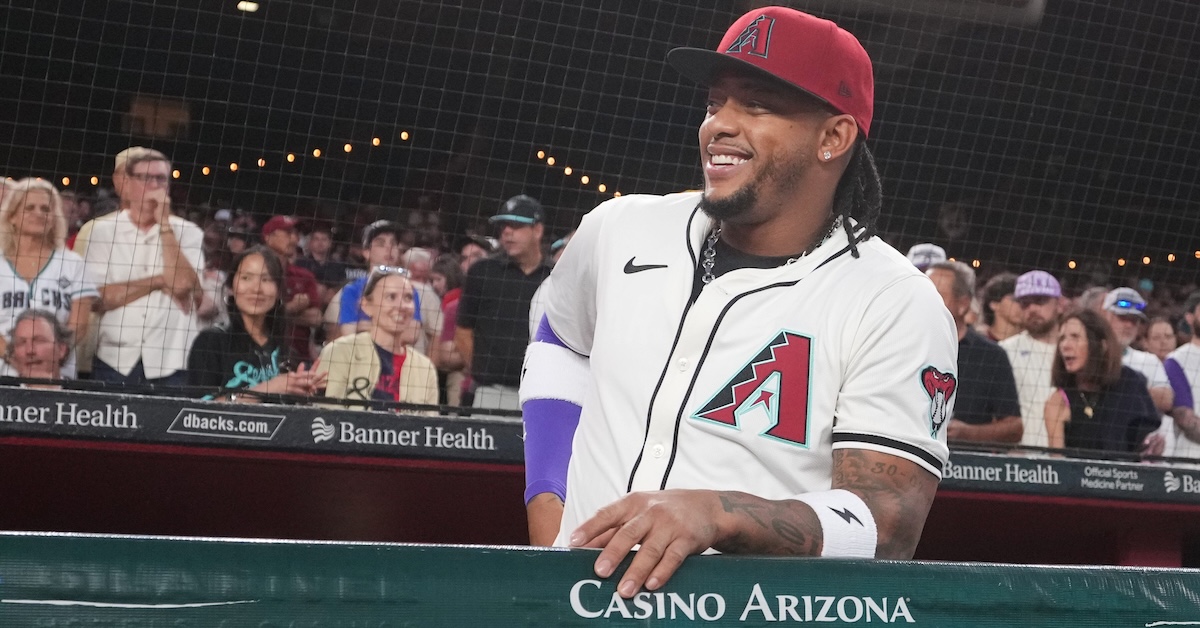
On Friday, Ben Clemens laid out five fun things to watch during the second half of the 2025 season. The one that caught my eye was the race to lead the league in bunts for base hits. The contestants all make plenty of sense. The group of Kyle Isbel, Jacob Young, TJ Friedl, Victor Scott II, and Xavier Edwards includes four light-hitting, fleet-footed center fielders and one light-hitting, fleet-footed shortstop. But there’s another bunting race going on, and in it, these four speedsters – along with everyone else in baseball – are getting dusted by Jose Herrera, the Diamondbacks backup catcher whom Statcast rates as the 491st fastest out of 510 qualified players this season. It’s the race to lead the league in sacrifice bunts, and no one in baseball is quite so eager to choose the greater good over their own personal gratification than Herrera.
| Name | Sac Bunts | Bunt Hits | Failed Bunts | Total Bunts |
|---|---|---|---|---|
| Jose Herrera | 10 | 0 | 0 | 10 |
| Kyle Isbel | 9 | 8 | 2 | 19 |
| Jacob Young | 8 | 7 | 4 | 19 |
| Myles Straw | 6 | 1 | 2 | 9 |
| Luis Arraez | 6 | 2 | 1 | 9 |
| Tyler Fitzgerald | 6 | 2 | 0 | 8 |
| Nathan Lukes | 6 | 1 | 0 | 7 |
| Victor Scott II | 5 | 6 | 7 | 18 |
| Joey Ortiz | 5 | 0 | 3 | 8 |
| Martín Maldonado | 5 | 0 | 2 | 7 |
| Nick Allen | 5 | 2 | 0 | 7 |
| Will Wilson | 5 | 0 | 0 | 5 |
| Alex Call | 5 | 0 | 0 | 5 |
| Ernie Clement | 5 | 0 | 0 | 5 |
| J.P. Crawford | 5 | 0 | 0 | 5 |
Actually, that’s not entirely true. Herrera is tied for fourth in attempted sac bunts. He just leads the league because he’s batting a thousand on his attempts. (Not literally, of course; a successful sac bunt doesn’t count toward your batting average at all.) The other players I’ve mentioned have failed, fouled, or whiffed on their bunts a lot, but not Herrera. We’re going to put Herrera’s proclivity for the sacrifice into context a little later, but let’s start with the obvious question. Why does Herrera bunt so much? It can’t just be because he’s good at it. It’s certainly not because he thinks he can beat out a hit with his third-percentile sprint speed. Often enough, he’s not even pretending to run hard. On this play, it’s not so much that he’s sacrificing himself as it is that he’s just kind of surrendering. Read the rest of this entry »
“Who you got?” It seems like such a simple question. If you’ve ever swapped baseball cards during recess or tried to pick somewhere to eat on a Friday night, you’ve asked yourself this. The choice between two options seems easy. But then you add a third option, and a fourth, and a 139th, and suddenly you’re obsessing over whether you’d prefer your third-favorite Thai restaurant to your fourth-favorite Italian place. Or perhaps, if you’ve used our new crowdsourced trade value tool, you’re deciding between CJ Abrams and Andrew Abbott. Making decisions is hard!
Welcome to the 2025 edition of our annual Trade Value series. Starting today and continuing all week, we’re releasing our list of the 50 most valuable players in baseball, taking player performance, age, and contract into account. Dave Cameron, Kiley McDaniel, Craig Edwards, and Kevin Goldstein have all headlined this column before; this is my fourth year doing it on my own.
Of course, “on my own” is a bit of a misnomer. The process of building this list starts with me gathering every possible input I can find: age, contract status, measures of current production, estimates of future production, Statcast data, pitch-level modeling, scouting reports – if it can be written down, I try to consider it in my first pass. I use all of those inputs to come up with an initial quantitative ranking, then hone that ranking by diving deeper into individual player comparisons. After I have things in good order, I consult with the FanGraphs staff to refine my thinking further. (Special thanks are due to Dan Szymborski for his ZiPS assistance, Eric Longenhagen for being a frequent sounding board as I iterated on the list, Meg Rowley for her help shepherding it through to publication, and Sean Dolinar for his technical assistance.) Next, I reach out to sources on the team side. Here I try to gather perspectives on player value from organizations that have different methodological leanings, different budgets and goals, and that are in different places in the competitive cycle. Read the rest of this entry »
Payton Tolle is the top pitching prospect in what is arguably baseball’s best farm system. Drafted 50th-overall last summer by the Boston Red Sox out of Texas Christian University, the 22-year-old left-hander features a fastball that Eric Longenhagen has assigned a 70 grade, and not just because of its high octane. Per our lead prospect analyst, the 6-foot-6, 250-pound hurler possessed “the 2024 draft’s most deceptive secondary traits,” which included seven-and-a-half feet of extension.
I asked Tolle about his four-seamer, which sat 95 mph when I saw toe the rubber for the Double-A Portland Sea Dogs versus the Hartford Yard Goats 10 days ago.
“The velo is something we’ve kind of driven hard ever since I got to the Red Sox org,” said Tolle, who was 90-92 in college and is now topping out at 98-99. “I’m buying into the system, buying into how the velo is going to change how everything looks. I also understand that more swing-and-miss is going to come at the top of the zone. At Wichita State, my first year, I felt like I was almost more sinkers, but then I switched up my grip. I brought my fingers closer together and started to have more ride on it.”
Tolle transferred from Wichita State to TCU for his junior year, where he — along with the Horned Frogs coaching staff — “really dove into how the fastball plays and what we can play off of it.” Since turning pro, that evolution has continued with a heavy emphasis on secondary offerings. Whereas his fastball usage as an amateur was often 70-75%, it has been closer to 50% in his recent outings. A work-in-progress changeup has become more prevalent — Tolle got bad swings on a few of them when I saw him in Portland — but a hard breaking ball is currently his top option behind his heater. Read the rest of this entry »